HU ZOOM TOTAL KO POKERSTARS
Hi everyone!
I’ve been playing poker for over 10 years, with more than $400k profit in MTTs. For the last 3 years, I’ve been playing HU ZOOM.
In 2025, I ran into one of the most serious downswings of my entire career. I’ve played over 1,700 of these tournaments, and the results have been very disappointing. The statistics raise some serious concerns.
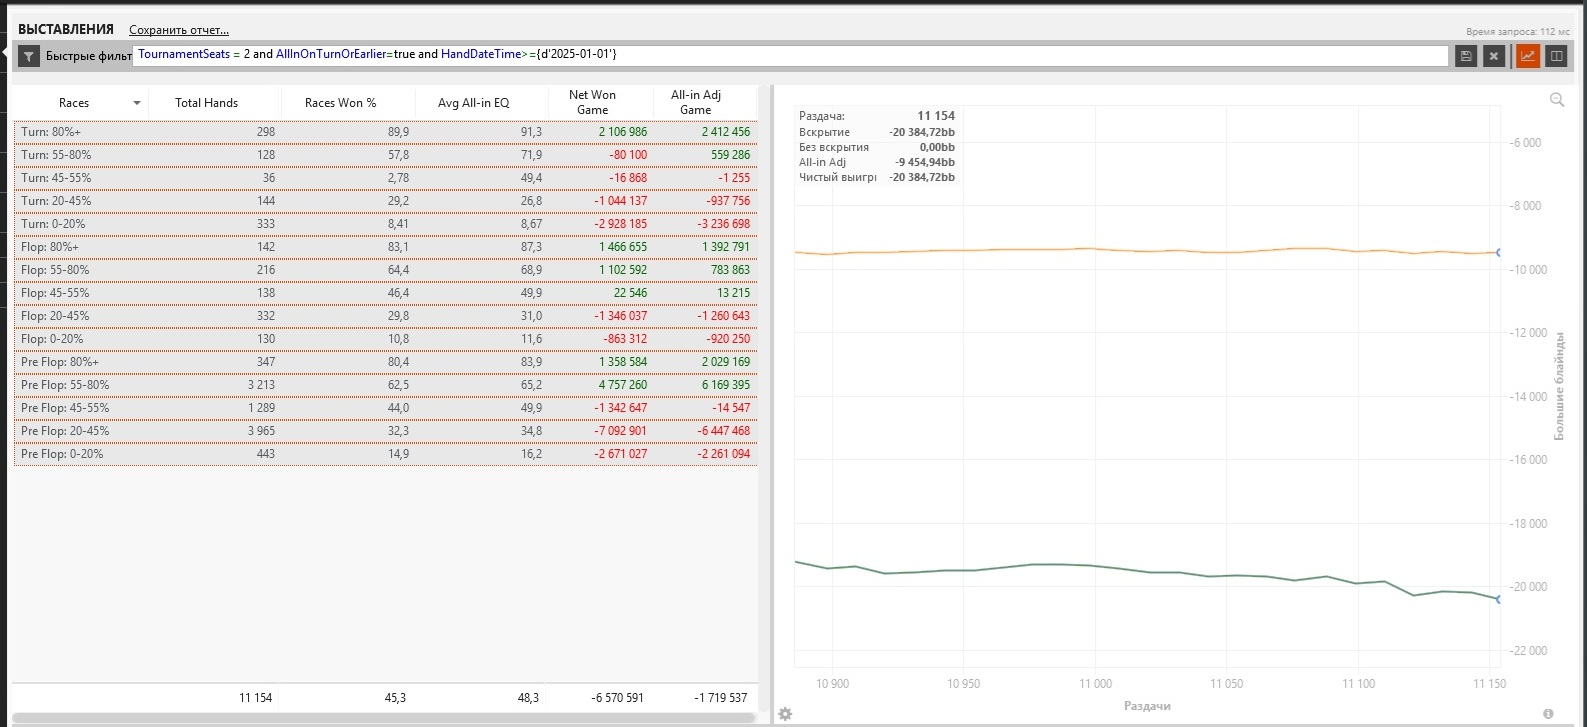
I started digging into my database and paid close attention to the Races metric (all all-ins with open cards and known equity for each hand on preflop, turn, and river). Since all of these are 1v1 all-ins, the statistic should be as clean as possible (no multiway pots, where the probability of calculation errors is higher).
Given that these are Total KO tournaments, where bounties play a major role, I believe this metric is one of the most important in this discipline. When I input the data into AI tools for analysis and calculate the statistical deviation, the result is an extremely unlikely outcome - about 1 in 5–6 billion probability.
You can verify this yourself using the following data:
Races(1v1)
Hands 11154
Avg.allin eq - 48,3%
Races won - 45,3%
[image]fqkwkwf.jpg[/im
..]
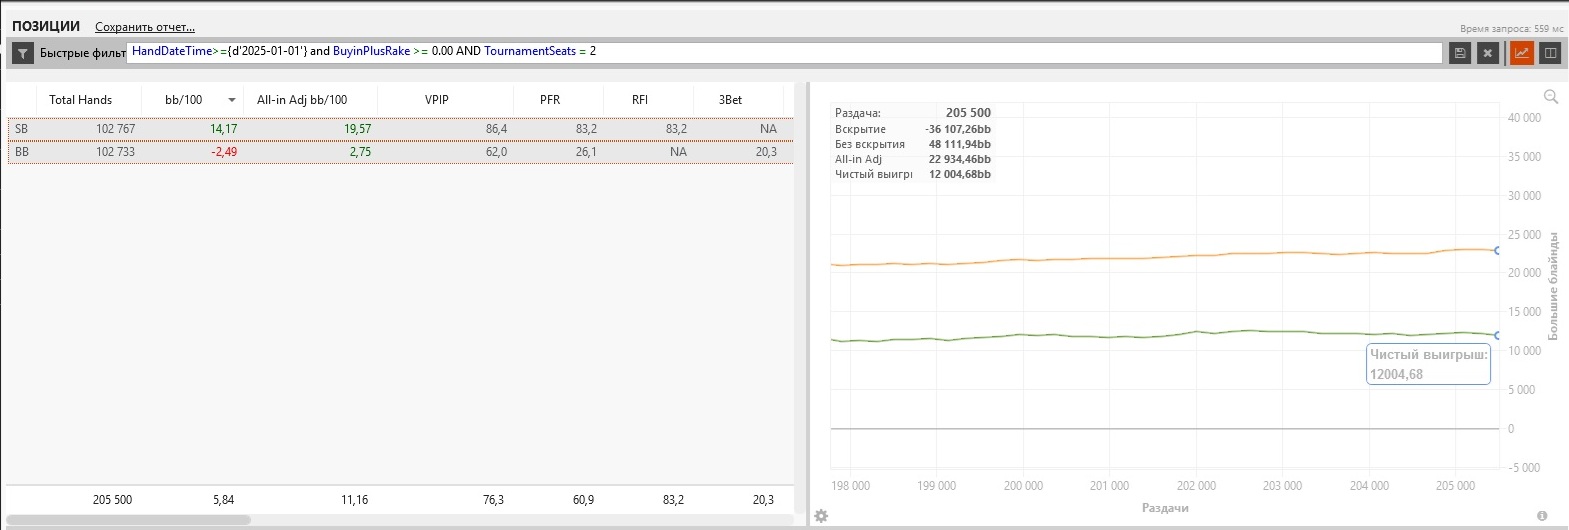
The EVbb statistics are also very poor. According to Primedope analysis, the probability of such an outcome is 0.7% - 3.5%, depending on the standard deviation used (100–140).
[image]2Z0JGOE.jpg[/im
..]
There is almost no information online about the Races metric, and very few people play this discipline, since in regular MTTs it doesn’t seem to matter much, at least in my understanding.
I’m simply looking for an outside perspective on this situation. The sample size is not small, and the statistics look anomalous. What are your thoughts?
How accurate is the Races metric, and should it be considered seriously in analysis?
Has anyone ever experienced a bad run like this in real life?
10 Replies
Hi!
I played these games from late 2019 until 2026 when stars got closed for my country.
You are right that this is an unique format where our usual simulations of cash game/mtt run doesn't quite apply, however we can extrapolate and make some assesments of what a good and bad run looks like. Your's is what a bad run looks like (3% under AIEV) and you can look up what the opposite looks like by looking at the sharkscope leaderboards for this format.
When flipping a coin 11k times you are way more likely to be over/under ev than exactly at your ev.
Another factor to consider is that these games have shrunk in guarantees and field sizes by over 70% since 2020 and nowadays it's basically a reg battle with very few fish, and your stdDev will be higher than 150. In 2019-2020 it was glorious, so many fishes and shitty passive regs you could just print. Nowadays it's becoming a multi table HU sng just played at deep stacks, there are some gifted players who will emerge with a higher winrate than others, for some the swings are gonna be mental.
Has anyone ever experienced a bad run like this in real life?
I had 11 month stretch where I ran 11k bb under ev in this format and it was the worst shit ever, in reality it feels (and is) WAY worse cause you are losing your $EV, chip EV and future EV (think losing a flip and being out vs winning a flip and being in the tournament with a chiplead and position to get more KOs). Still had deepruns every day, probably finished top 7 about 100 times with nothing to show for it.
I’m simply looking for an outside perspective on this situation. The sample size is not small, and the statistics look anomalous. What are your thoughts?
Statistics doesn't look anomalous to me, sample size is not that singificant. Focus on improving your strategy, perhaps you need to go all in more? 😋
DM me if you want more secrets revealed
I didn’t play during 2019–2020; I entered this format in 2023. However, I still consider the field to be very soft. In 2023–2024 my winrate was around $30 per tournament, while running about 1.5% under AIEV, so it’s hard to say variance was on my side 😀 In 2025 my winrate dropped to around $6 per tournament with roughly 3% under AIEV.
When flipping a coin 11k times you are way more likely to be over/under ev than exactly at your ev.
Overall, you’re using the coin-flip analogy and arguing that being above or below EV is more likely than landing exactly on EV. When I suggested calculating this more precisely using AI, the point was that the probability of such an outcome is around 1 in 4–5 billion. For comparison, the world’s population is only about 8–9 billion. That makes this outcome practically impossible in real life. Wouldn’t that be considered anomalous statistics?
I had 11 month stretch where I ran 11k bb under ev in this format and it was the worst shit ever, in reality it feels (and is) WAY worse cause you are losing your $EV, chip EV and future EV (think losing a flip and being out vs winning a flip and being in the tournament with a chiplead and position to get more KOs). Still had deepruns every day, probably finished top 7 about 10
I’ve been running over 11k below EV for 13 months straight across 210, 000 hands, on top of the anomalous deviation in races.
Statistics doesn't look anomalous to me, sample size is not that singificant. Focus on improving your strategy, perhaps you need to go all in more? 😋
Regarding my strategy: I track statistics where the opponent’s stack is converted into dollar value and use a calculator built around that. I understand that in this format EVBB is less important than knowing where to push. Even though I often push at the expense of EVBB, my overall EVBB is still strong, which suggests my postflop play is solid as well. Overall, races are an extremely important metric, and any deviation from expected outcomes - especially one with a probability of 1 in 4–5 billion - has a massive impact on $EV.
In 2023–2024 my winrate was around $30 per tournament, while running about 1.5% under AIEV, so it’s hard to say variance was on my side 😀 In 2025 my winrate dropped to around $6 per tournament with roughly 3% under AIEV.
It's too small of a sample, with 10 year mtt experience you should know that. And 6$ per tournament in 2026 is still more than most mtt regs will make.
I’ve been running over 11k below EV for 13 months straight across 210, 000 hands, on top of the anomalous deviation in race
It can happen and it feels worse than words can explain
When I suggested calculating this more precisely using AI, the point was that the probability of such an outcome is around 1 in 4–5 billion. For comparison, the world’s population is only about 8–9 billion. That makes this outcome practically impossible in real life.
I'm curious to know what AI suggested you the odds of this, but running a couple simple sims in primedope both for tournaments and HU cash games we can see that a 13BB/100 player after 200k hands can be in the red.... or up heaps and feel like a rockstar
Bro, i didn’t focus on a large deviation in EVbb at all. Please reread the post.
What I specifically described is an anomalous deviation in the Races metric. I explained how I identified this using AI-based analysis. I am not claiming that the AI calculations are 100% correct, but the result looks unusual, which is exactly why I shared it to hear opinions from people who are knowledgeable in statistics and probability theory.
Data
• N = 11,154 1v1 all-ins
• Expected probability (p) = 48.3% = 0.483
• Observed probability (p̂) = 45.3% = 0.453
Difference:
\Delta = 0.483 - 0.453 = 0.030
⸻
1️⃣ Standard deviation of the proportion
\sigma = \sqrt{\frac{p(1-p)}{N}}
p(1-p) = 0.483 \cdot 0.517 = 0.2498
\sigma = \sqrt{\frac{0.2498}{11154}} \approx \sqrt{2.24 \cdot 10^{-5}} \approx 0.00474
👉 σ ≈ 0.474%
⸻
2️⃣ Z-score (number of standard deviations)
Z = \frac{0.030}{0.00474} \approx 6.33
👉 −6.3σ underperformance
⸻
3️⃣ Probability of such an outcome
For a normal distribution:
• 6.0σ ≈ 1 in 1 billion
• 6.3σ ≈ 1 in 3–4 billion
• 6.5σ ≈ 1 in 10 billion
👉 In this case:
P \approx 2 imes 10^{-10}
≈ 1 chance in 4–5 billion
⸻
4️⃣ Number of “missing” all-ins
Expected wins:
11154 \cdot 0.483 \approx 5386
Observed wins:
11154 \cdot 0.453 \approx 5050
Difference:
\approx 336 ext{ all-ins}
👉 ≈ −336 all-ins
Possible reasons in my opinion:
1.Problem with HM3 data collection
2.Incorrect calculations in Races (I manually checked 20 hands - all ok)
3.The AI miscalculated the probability
4. Just unlucky
5. Problem with the RNG
I used chatGPT to try and recreate your experiment, it calculated that odds of being 300 flips down after 10k is roughly 1:950 million when standard deviation is 50
It then offered me to translate this into poker winrates and I gave it a bunch more information to work with, and it's answers were generally reasonable in my opinion. Make it calculate your downswing for a game with a stdDev of 150 and your downwing is not unusual at all.
You have multiple factors that increase the variance at play : heads up, tournaments, total KO structure
It's unlucky and psychologically brutal, better not to think about it 😂
I understand what you mean about variance in MTTs and Total KO tournaments - indeed, taking all factors into account (stack sizes, bounty structure, multiway pots), the effective standard deviation is much higher.
However, all these factors do not affect the Races metric at all. Here we are only looking at 1v1 all-ins, where the cards are known and the exact equity of each hand is also known. In this case, each all-in is a pure binomial event: you either win or lose the hand. The standard deviation here is strictly determined by the binomial formula:
\sigma = \sqrt{\frac{p(1-p)}{N}}
where p is the equity and N is the number of all-ins. There are no other sources of variance — σ cannot change.
So when I calculate −6.3σ for my 11,154 1v1 all-ins, this is mathematically correct for this metric. The “large standard deviation” you are referring to applies to full tournament results, where many other factors influence the variance. But for pure 1v1 all-ins with known equity, that reasoning does not apply.
P.S. I used ChatGPT a bit in my reply to express my point more accurately and factually, and to explain why my calculations are more likely to be correct.
Okay so if your run over 200k sample is 1:4.5Billion unlucky ...
and my run over 200k sample is 1:4.5Billion unlucky ...
Nice to meet you, we might be the only ones on this planet 😃
Hopefully someone else chimes in but id guess less than 100 ppl have 200k hands in this format
So, I started digging deeper into my HM3 database and found an error in the calculations. HM3 counts split pots as wins, which is exactly why those anomalous values appeared.
So it’s not that scary after all. There is some underperformance, but it’s well within standard variance:
2.7σ ≈ 1 in 150–200.
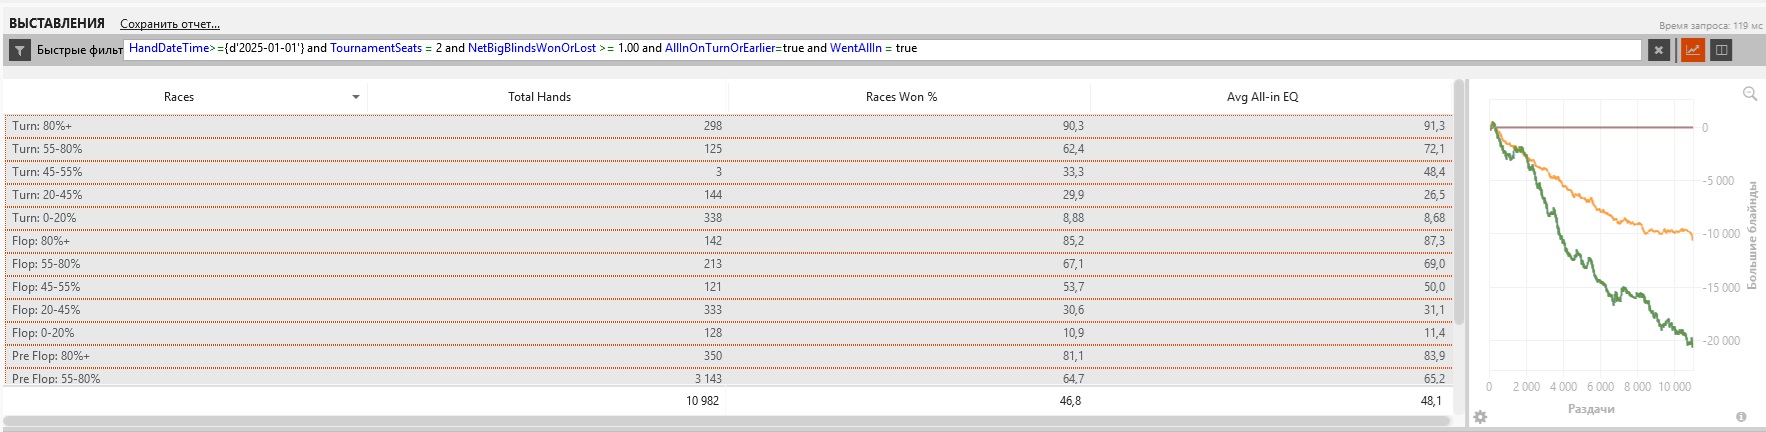
Overall, this metric is actually very good for identifying downswings. And ChatGPT’s calculations using the binomial distribution are absolutely correct.
The only important thing is to apply the following filter to races metric:
NetBigBlindsWonOrLost ≥ 1.00
This excludes spots where HM3 makes counting errors.
So the topic is closed. Mikus, thanks for the feedback - thanks to you I dug much deeper into the database. Good luck!

